case study
Zippix financial operations dashboard case file.
Zippix brought client profiles, transaction context, progress tracking, filtering, and dashboard insights into a calmer workspace for financial advisors.
← all case files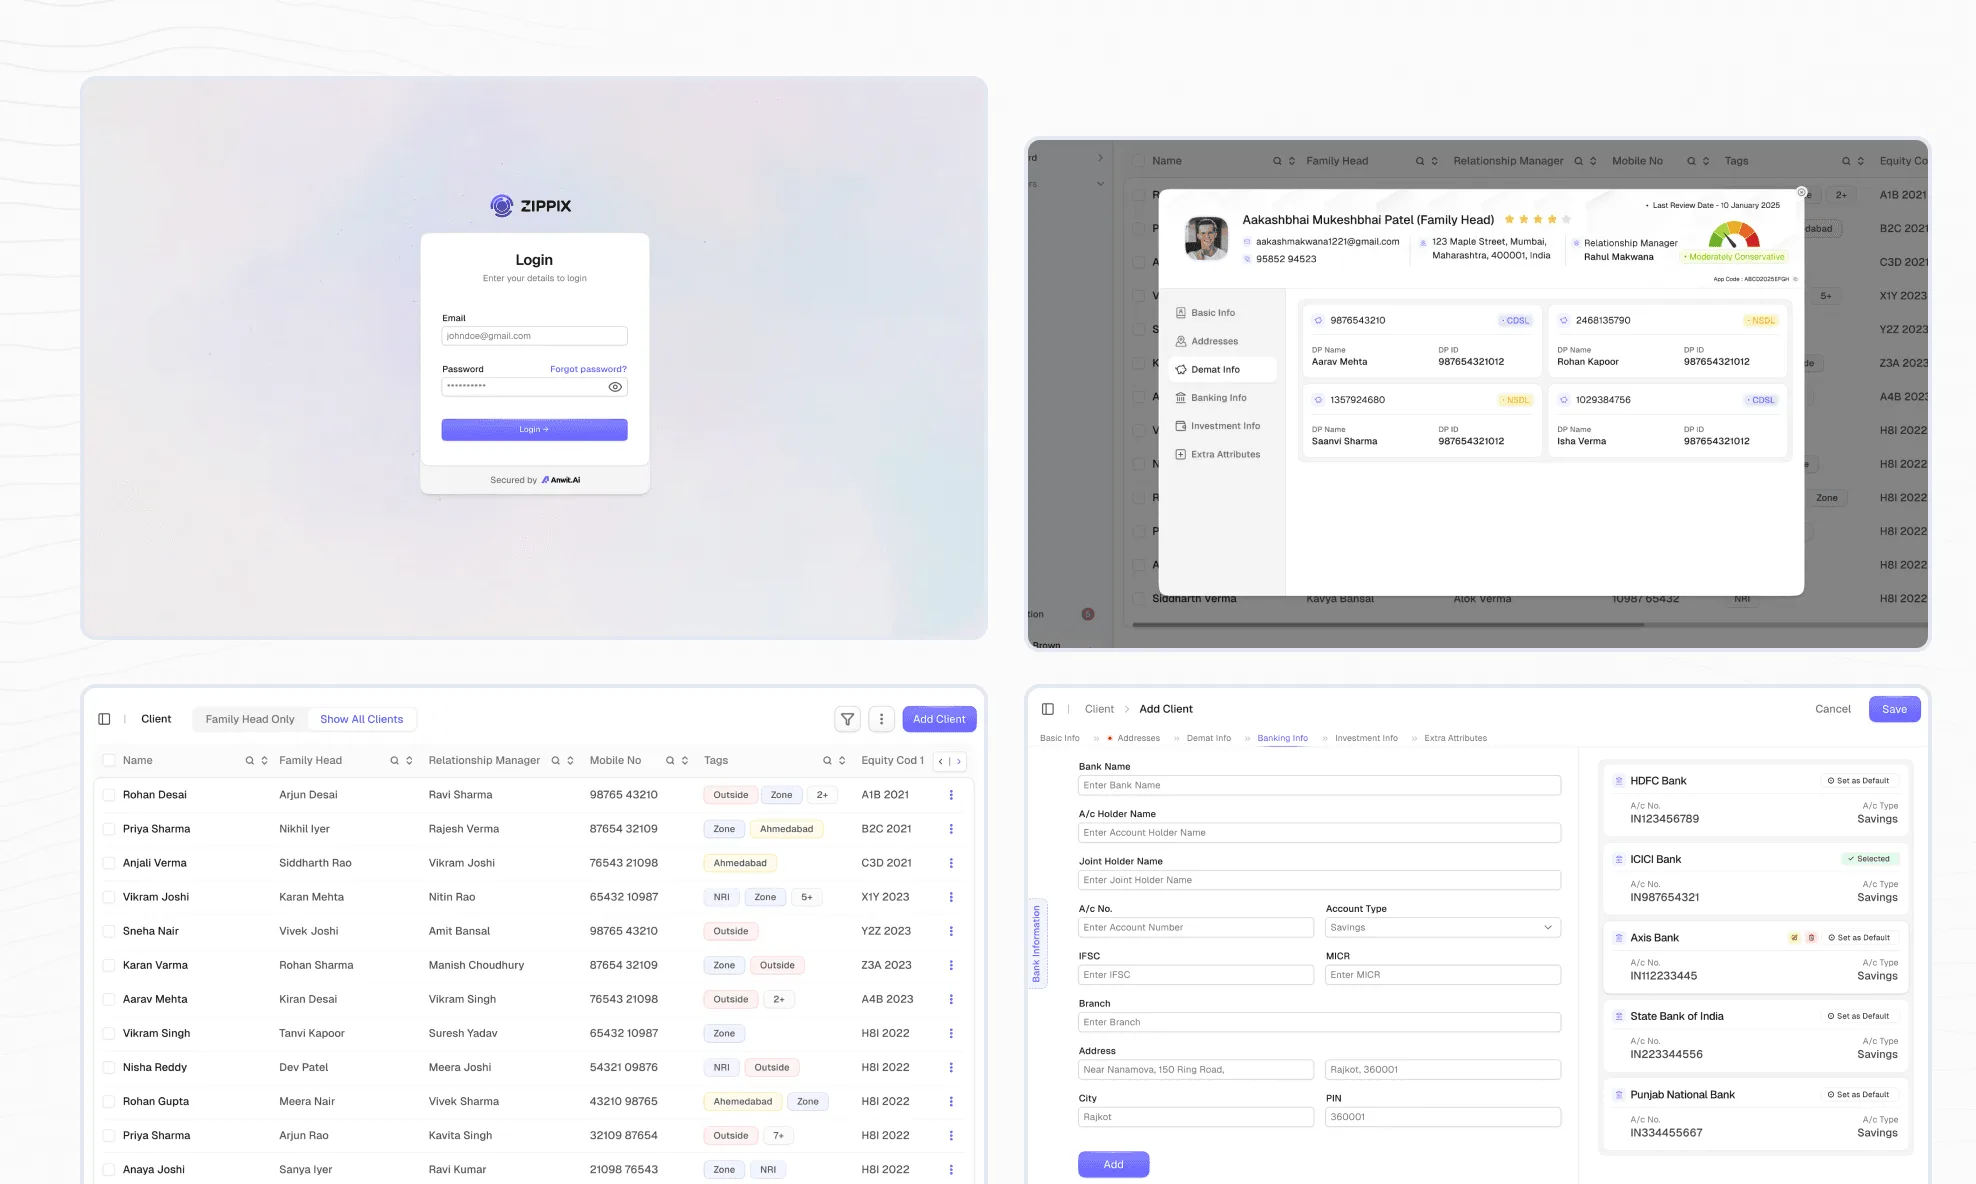
the build
What the build actually covered.
workflow decisions
-
Reduced cognitive load with clearer hierarchy for client and transaction data.
-
Brought profile, progress, and transaction context into one connected view.
-
Used filtering and search as workflow tools, not secondary table features.
engineering scope
-
Dashboard UX architecture.
-
Client profile modules.
-
Advanced filter and search patterns.
-
Progress tracking views.
related services
-
Internal tools and dashboards
-
UX and product design
-
Product engineering
stack and patterns
-
Dashboard UX
-
Internal tools
-
Data-heavy product design
-
Client management workflows
product evidence
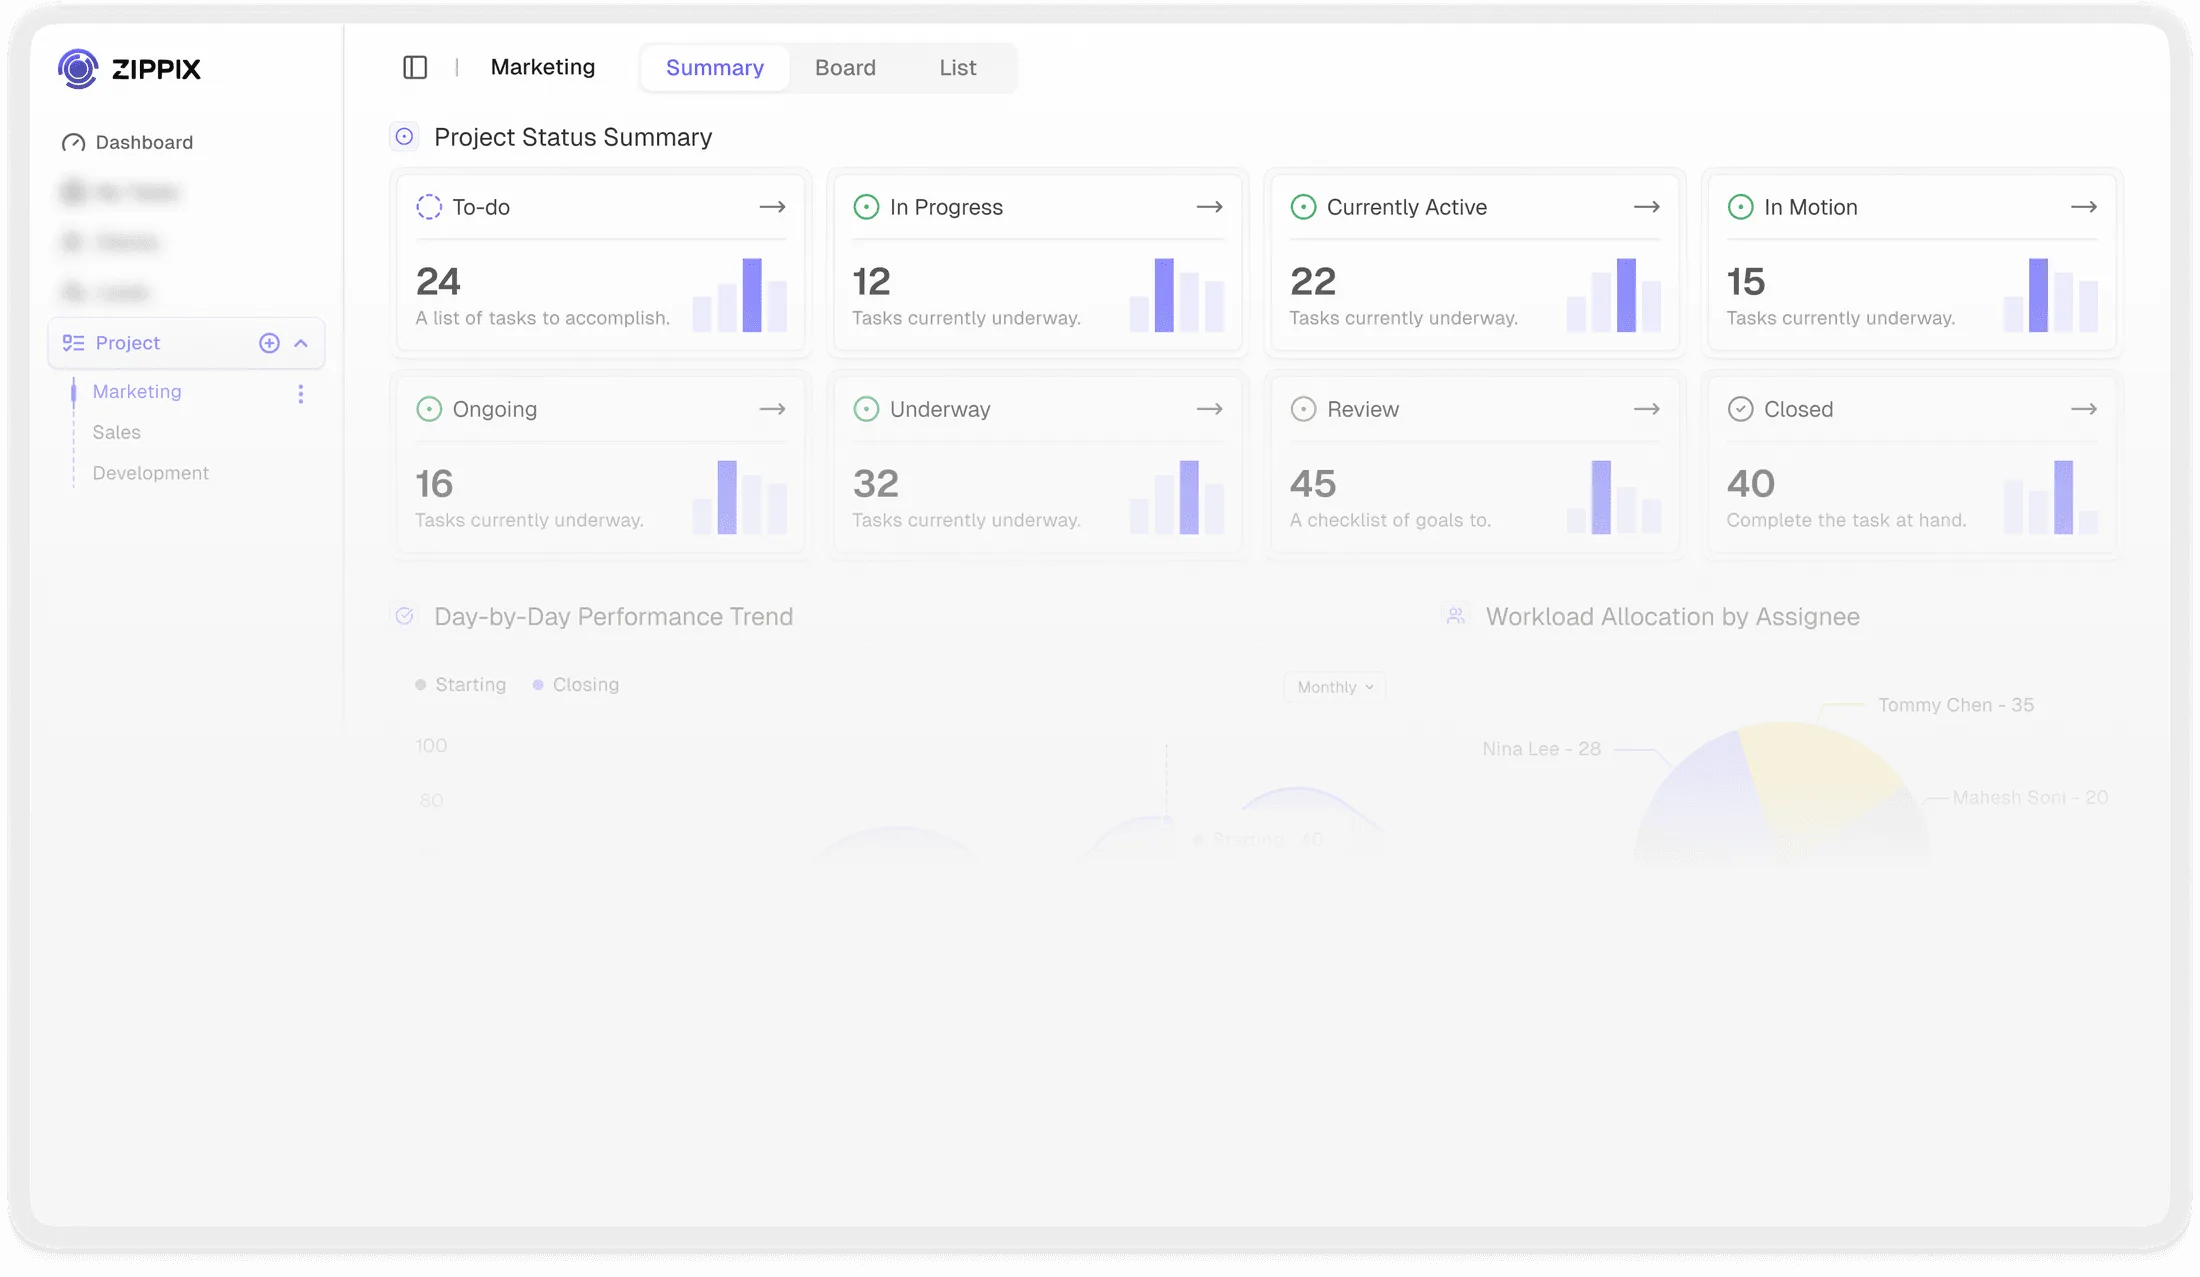
How financial client work became easier to scan and act on.
The product turned disconnected client records, transactions, filters, and progress states into a calmer advisor workspace built for quick decisions and accountable follow-up.
Unified client dashboard.
Profile, transactions, history, and progress all live next to each other instead of across separate tabs and tools.
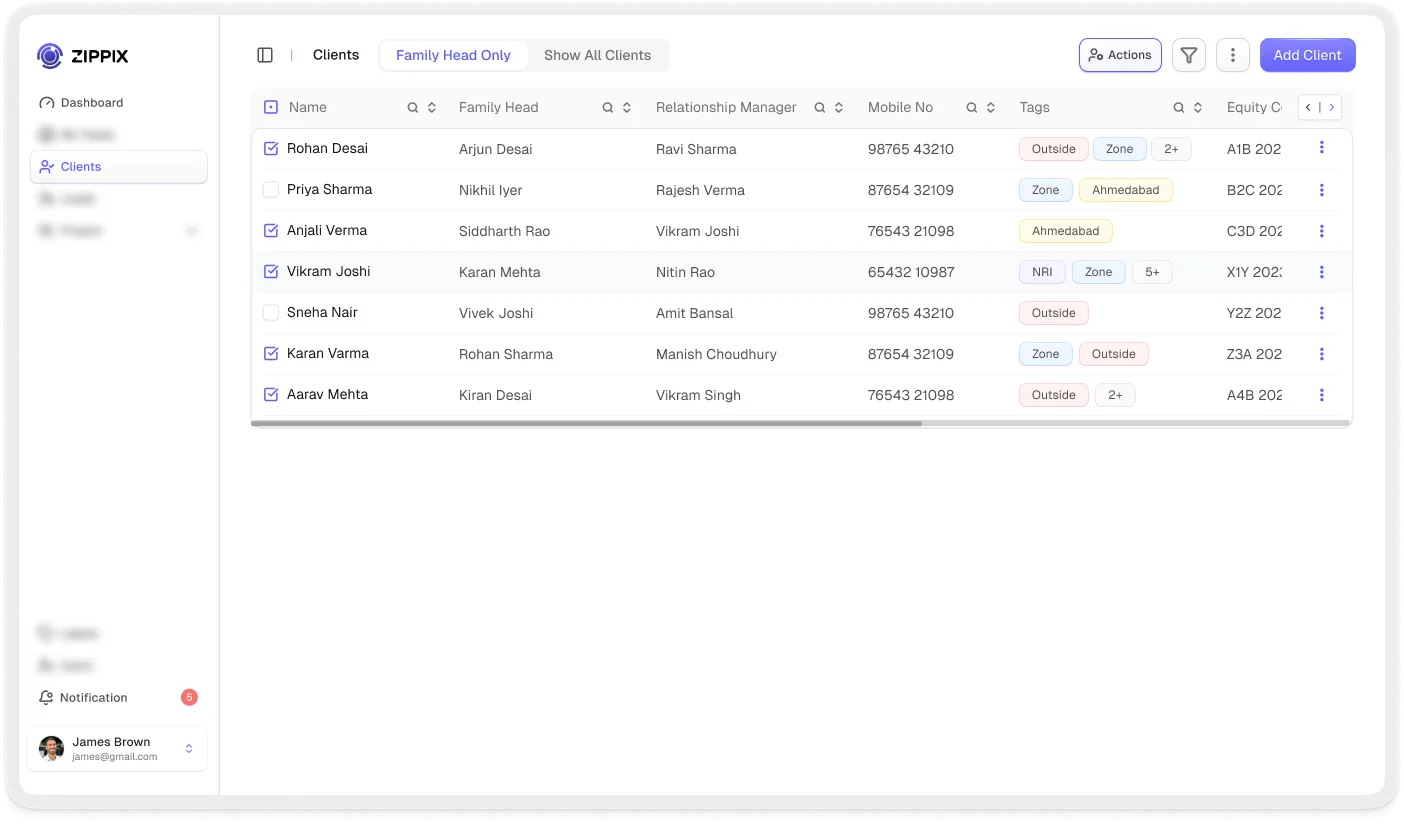
Advanced filters and smart search.
Contextual navigation makes finding the right client or transaction fast, even across large books of business.
Progress tracking system.
Follow-ups and milestones move through clear states, replacing guesswork with a visible workflow.
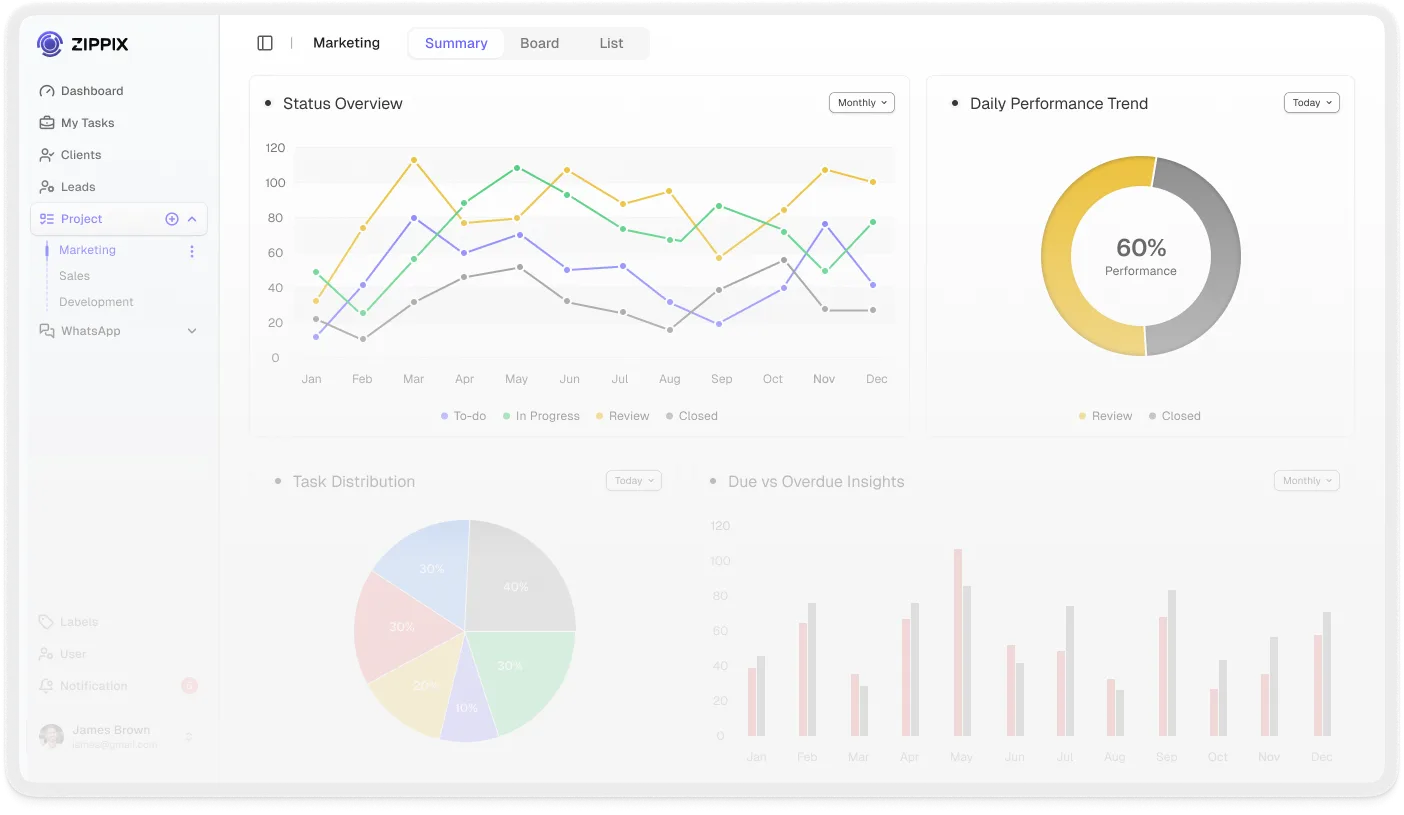
Data turned into a narrative.
Color-coded charts and metrics translate financial numbers into something advisors can scan and act on quickly.